

About
Replication-associated gene dosage effects
Maximal growth rates are central to microbial life-history strategies because there is a trade-off between fast growth in copiotrophs and scavenging potential in slow-growing oligotrophs. When E. coli’s generation time decreases from 100 to 24 min, cellular RNA polymerases (RNAP) are multiplied by 15 and ribosomes by 10. Thus, high growth rates result more from the increase in the production of the gene expression machinery than from its increasing productivity. At high growth rates, about 74% of all E. coli transcription concerns the production of stable RNA. As a result, genomes of fast growing bacteria tend to enjoy a double gene dosage effect: multiple gene copies, mostly affecting stable RNA genes, and positioning of highly expressed genes near the origin, which also affects protein-coding genes. These allow attaining high levels of expression for ribosomes and other gene expression-related genes, which constitutes a metabolic burden at lower growth rates. We found that gene dosage effects translate in a selective advantage for highly expressed genes near the origin, such as rDNA, ribosomal proteins (RP) and RNA polymerase (RNAP) genes (Figure 1). We observed in the group with strong gene dosage effects that the order of the average distance to the origin of replication is most frequentely the following: RNAP, rDNA, ribosomal proteins and other highly expressed genes. Interestingly, this matches the order of regulation of these genes during fast growth. This strongly suggests an association between gene dosage, coding position and regulatory dependencies among these genes. One cannot but wonder how many other regulatory cascades are similarly imprinted in the organisation of bacterial genomes.
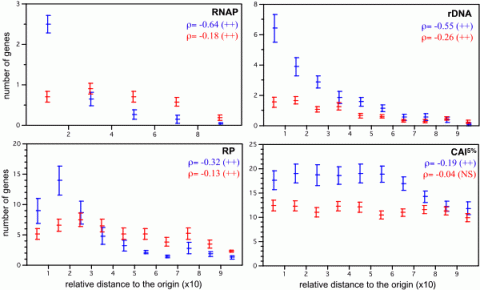
- Figure 1- Repartition of sets of genes along the bacterial chromosomes (slow growing, in red, and fast growing, in blue). + : p-value < 0.05; ++ : p-value < 0.001. NS – non-significantly different from zero (from Couturier, Molecular Microbiology, 06).
Codon usage bias
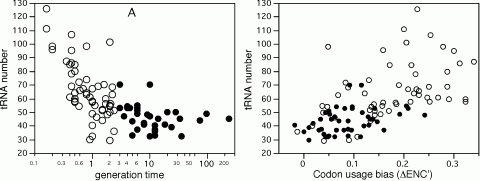
Due to the degeneracy of the genetic code, many codons are synonymous for the same amino acid. Nevertheless, some synonymous codons are more abundant than others. This is the result of mutational biases and selective forces. Mutational biases include genome G+C content, compositional strand bias, and transcription coupled repair associated biases. Because translation is the most energetically expensive process occurring in exponentially growing cells, its efficiency is under important selective pressure. Under these physiological conditions, a small set of genes, mostly translation-associated genes, accounts for the large majority of transcription and translation taking place in the cell. In this context, the most favourable codons are the ones corresponding to the most abundant and efficient cognate aa-tRNA present in the cell. Selection for codon usage bias can arise for elongation speed, and indeed different codons have different translation rates. Selection can also arise for accuracy, if some codons are less prone to mistranslation or drop-off events, but the determinants of accuracy have been proven difficult to identify. By analyzing 102 genomes we showed that as minimal generation times get shorter, the genomes contain more tRNA genes, but fewer anticodon species. Surprisingly, in spite of the wide G+C variation of bacterial genomes these anticodons are the same in most genomes. This suggests an optimization of the translation machinery to use a small subset of optimal codons and anticodons in fast growing bacteria and in highly expressed genes. As a result, the over-represented codons in highly expressed genes tend to be the same in very different genomes to match the same most frequent anticodons. This is particularly important in fast growing bacteria, which have higher codon usage bias in these genes. Thus, co-evolution of tRNA gene composition and codon usage bias in genomes seen from tRNA’s point of view agrees with the selection-mutation-drift theory. However, it suggests a much more universal trend in the evolution of anticodon and codon choice than previously thought. It also provides new evidence that a selective force for the optimization of the translation machinery is the maximization of growth.
Phages and codon usage
When a phage propagates in a bacterium cell, it is in its best interest to have a codon usage bias compatible with the one of the bacteria as that will facilitate the expensive and laborious mechanism of protein synthesis. Yet, this may be impossible to achieve because phages share with other parasitic DNA a tendency to be A+T rich relative to their bacterial hosts. The gap between phage and host genome compositions makes it difficult for the phage to perfectly fit the host codon usage. Phages often have tRNA genes, which has been commonly thought to result from selection for elements sharing homologies with the chromosome to facilitate integration. We investigated the relationship between tRNA copy number and codon frequency in bacteriophage genomes relative to their hosts. We found ample evidence against tRNAs being selected to facilitate phage integration in the prokaryotic chromosomes. Instead, there is a significant association between tRNA distribution and codon usage. We supported this observation by introducing a master equation model, where tRNAs are randomly gained from their hosts and then lost either neutrally or according to a set of different selection mechanisms. The tRNAs present in phages tend to correspond to codons which are simultaneously highly frequent in the phage genes while rare in the host. Accordingly, we propose that selective recruitment of tRNAs by the phage compensates for the compositional differences between its genome and the hosts’. To further understand the importance of these results in phage biology we analyzed the differences between temperate and virulent phages. Virulent phages contain more tRNAs than temperate ones, higher codon usage biases and more important compositional differences with the host genome. These differences are thus in perfect agreement with the results of our master equation model and further suggest that tRNA acquisition may contribute to higher virulence. Thus, even though phages use most of the cell’s translation machinery, they can complement it with their own genetic information to attain higher fitness. These results suggest that similar selection pressures may act upon other cellular essential genes that are being found in the recently uncovered large viruses.
Prediction of growth rates
Microbial minimal generation times range from a few minutes to several weeks. They are evolutionarily determined by variables such as environment stability, nutrient availability and community diversity. Selection for fast growth adaptively imprints genomes, resulting in gene amplification, adapted chromosomal organization and biased codon usage. Because growth rates are outcomes and constraints of microbial life-history strategies, it is important to understand the mechanisms allowing fast growth and how they are imprinted by natural selection in genomes. Inversely, it would be extremely useful to predict maximal growth rates from sequence alone. This would allow establishing generation time predictions for the vast numbers of unknown or uncultivated bacteria for which we lack such information.
We found that these growth-related traits in 214 species of bacteria and archaea are highly correlated, suggesting they all result from growth optimization. While modeling their association with maximal growth rates in view of synthetic biology applications, we observed that codon usage biases are better correlates of growth rates than any other trait, including rRNA copy number. Systematic deviations to our model reveal two distinct evolutionary processes. First, genome organization shows more evolutionary inertia than growth rates. This results in over-representation of growth-related traits in fast degrading genomes. Second, selection for these traits depends on optimal growth temperature: for similar generation times purifying selection is stronger in psychrophiles, intermediate in mesophiles and lower in thermophiles. Using this information, we created a predictor of maximal growth rate adapted to small genome fragments. We applied it to three metagenomic environmental samples to show that a transiently rich environment, as the human gut, selects for fast-growers, that a toxic environment, as the acid mine biofilm, selects for low growth rates, whereas a diverse environment, like the soil, shows all ranges of growth rates. We also demonstrate that microbial colonizers of babies gut grow faster than stabilized human adults gut communities. In conclusion, we show that one can predict maximal growth rates from sequence data alone and we propose that such information can be used to facilitate the manipulation of generation times. Our predictor allows inferring growth rates in the vast majority of uncultivable prokaryotes and paves the way to the understanding of community dynamics from metagenomic data.

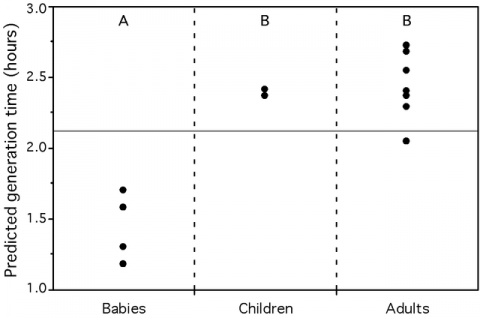 Figure 3 – Average predicted minimum generation time for 3 environmental metagenomes (left) and in the human gut (right). Crosses represent the average for the whole metagenome approach while dots represent the average for the pseudo-genome approach. Groups not connected by the same letter (A or B) are significantly different (Tukey-Kramer: p-value<0.005). The full horizontal line represents the average of the predictions for all individuals (from Vieira-Silva, Plos Genetics, 2010).