Présentation
The perspective to harness the potent immunosuppressive activity of CD4+FOXP3+ regulatory T cells (Treg) for clinical applications has sparked enormous interest in this cell population. Recent studies, however, have shown that the human Treg landscape may be more complicated than previously thought: not only do several distinct Treg subsets exist, but also the possibility has been raised that Treg may represent a “plastic” lineage with propensity to convert into an inflammatory cell phenotype. Understanding the heterogeneity of human Treg and their potential for lineage reprogramming to pro-inflammatory effector T cells is of critical importance for moving Treg therapy into the clinics.
Using multi-parameter single-cell analysis techniques we have explored the heterogeneity and functional diversity of human Treg in healthy donors and in the severely inflammatory and lymphopenic environment of patients after allogeneic hematopoietic stem cell transplantation (HSCT). Human Treg displayed a level of complexity similar to conventional CD4+ effector T cells with respect to the expression of transcription factors, homing receptors and inflammatory cytokines. Single-cell profiling of very small populations of IFN-γ and IL-17A-producing Treg showed an overlap of gene expression signatures of Th1 or Th17 cells and of Treg within the same cell.
To assess if Treg homeostasis is affected by an inflammatory and lymphopenic environment, we characterized the Treg compartment in patients at the time of engraftment (15 – 30 days after HSCT). This analysis revealed a marked depletion of Treg with a naïve phenotype in patients developing acute graft-versus-host disease, compared to tolerant patients. However, single-cell profiling showed that CD4+FOXP3+ T cells maintain the Treg gene expression signature and Treg suppressive activity was preserved.
Our cross-sectional study of CD4+FOXP3+ T cells in HSCT patients at the time of engraftment shows that CD4+CD25highCD127- T cells maintain suppressive activity and high expression levels of Treg markers such as FOXP3, CTLA4 and IKZF2, despite a severely inflammatory and lymphopenic environment. This argues in favor of Treg being a stable lineage. We therefore propose that heterogeneity at the single-cell level, rather than lineage-reprogramming of CD4+FOXP3+ T cells, explains the remarkable complexity and functional diversity of human Treg.
Moreover, our study demonstrates that multi-parameter single-cell analysis techniques not only uncover previously unappreciated levels of heterogeneity within cell “subsets”, but can also provide valuable information about transcriptional networks in single cells. The use of single-cell analyses offers the unique opportunity to investigate the early events that shape immune reconstitution after HSCT, at a time point when it may still be possible to tilt the balance between excessive inflammation and tolerance induction (Dong et al, 2013).
This study is performed in collaboration with Pr. Gérard Socié and his team at Hôpital St. Louis in Paris.

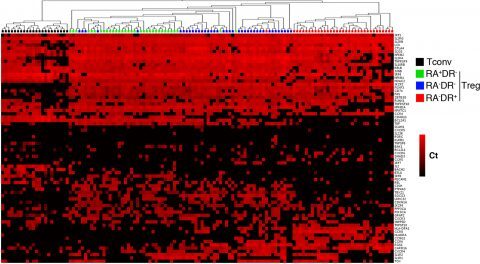
Figure 2: Single cell gene expression profiling reveals heterogeneity within regulatory T cell sub-populations
Three regulatory T cell subpopulations were sorted from adult peripheral blood of healthy donors. Each population was stimulated with CD3/CD28 coated beads for 24h then sorted as single cells into 96 well plates. Expression of the indicated mRNA transcripts was assessed by single-cell quantitative RT-PCR using microfluidic arrays (Fluidigm). The heat map representation of single-cell gene expression profiling was obtained by 2-dimensional hierarchical clustering analysis using euclidean distance and average linkage using Qlucore Omics Explorer software. Each row corresponds to the expression level (Ct value) of a single gene and each column represents a single cell (black squares: naïve conventional CD4+ T cells, green squares: RA+DR- Treg, blue squares: RA-DR- Treg and red squares: RA-DR+ Treg). This analysis demonstrates that some genes are uniformly expressed by all cells, within a defined population, while expression of other genes is very heterogeneous (Figure 2 in Dong et al, 2013).

